|
|
|
|
|
Minnesota West Ag Services, LLC
Options
Seasonal Trends, Basis & Carry
Marketing Resources
Market Data
News & Commentary
Weather
Links
|
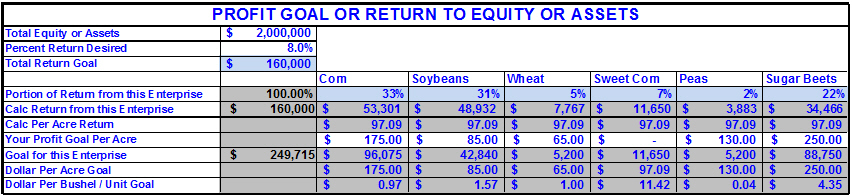
Production Costs Minnesota West Ag Services believes that the first step to profitable marketing is to understand your costs. With an easy to use format, we help producers list their expected variable costs, land costs, and fixed costs to establish a "Profit Matrix," "Revenue Goal" and "Sensitivity Analysis" for each of their crops. During the planing stage MNWestAg uses the "MNWestAg Position Manager" software and a forward looking approach to help producers estimate their cost of production. Revisions can be made throughout the year to update costs to provide producers with their actual cost of production. The estimated cost values established are used within the sales tracking section of the "MNWestAg Position Manager" to provide the producer with analysis of profitability. The first step is to list the planting intentions and crop insurance program  The Second step is to estimate the variable costs per acre for each crop.  The variable costs per enterprise are then automatically calculated for each crop using the planted acres.  The Third step is provide the costs for rented land and owned property to calculate an average land cost.  The Forth step is to provide fixed costs. Using a percentage allocation based on criteria such as crop acres for each crop or allocations to livestock enterprises, reports are generated for fixed costs allocated to each enterprise by both total dollars and dollars per acre.  The Fifth and final step involves establishing a Profit Goal or Return To Equity or Assets. By using the producer's total equity or assets and a percent return, a simple allocation can be made to establish a calculated return goal for each enterprise. The profit goal can then be modified to meet the producers realistic goals to use a meaningful and realizable goal based on the expectations for an individual crop marketing year.
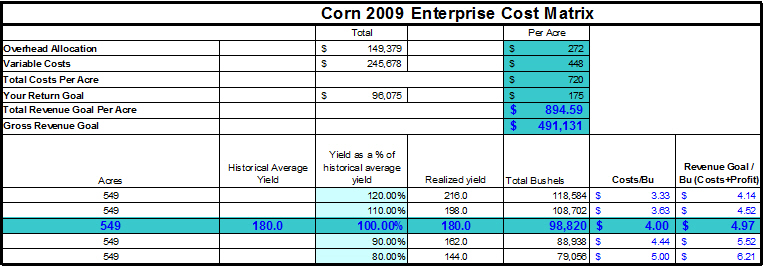
The Profit Matrix is calculated from the associated costs listed for each crop. The Cost/Bu column are the actual or expected cost for the enterprise at the yield listed in each row. The blue highlighted row has the values that are used for the expected or realized yield. The revenue goal/bu shows the estimated cost plus the goal.
A Sensitivity Analysis for each crop provides a look at profitability per acre. The analysis can also show the impact of basis on the potential outcome. In addition the crop insurance revenue floor values can be enabled and reflected within the sensitivity analysis. 
Screen shots are from the MNWestAg Position Manager Copyright 2011 Minnesota West Ag Services, LLC
|
|
|
